How Vizzbud Works
Vizzbud is a free scuba diving platform that shows you real time dive conditions, marine forecasts, and everything you need to plan safer, smarter dives.
What is Vizzbud?
Vizzbud is a diving platform built to make planning dives simpler and clearer. Whether you are a beginner checking conditions for your first shore dive or an experienced diver comparing forecast windows across multiple sites, Vizzbud turns complex marine data into information you can act on.
The platform combines live swell and wind forecasts, exposure analysis tailored to each site, and practical dive instructions so you can quickly judge whether a location is suitable before heading out. Each dive site page includes guidance on how to dive it safely, covering entry points, hazards, depth, and marine life, not just what the ocean is doing.
Beyond conditions, Vizzbud is a hub for divers. You can explore dive sites by region, save your favourites, track and log your dives, and build a personal history of your diving activity over time. Vizzbud currently covers dive sites across Australia with selected international locations being added regularly.
Key Features
Interactive Dive Map
Browse dive sites on a live map with colour coded markers that show conditions at a glance. Search for any site, zoom into your area, or use your GPS location to find the nearest options.
Real Time Conditions
See current wave height, wave period, wind speed, wind direction, swell direction, and water temperature for every dive site, updated multiple times per day from marine weather models.
24 and 48 Hour Swell Forecasts
Each site includes an interactive swell chart that lets you toggle between a 24 hour and 48 hour forecast window. The chart is colour coded by condition status so you can spot the best dive windows quickly.
Day Part Forecasts
Conditions broken down by morning, afternoon, and evening for the next three days. Each time window shows its own status, wave data, and wind data so you can plan around the best period.
Detailed Dive Site Guides
Every site has a dedicated page with dive instructions, entry points, depth, hazards, marine life, dive maps, and local tips. It covers everything you need to dive the site safely and confidently.
Personal Dive Log
Log every dive with depth, duration, visibility, water temperature, and notes. Your dive log builds a personal history you can reference when planning future dives or tracking your progress.
How to Use Vizzbud, Step by Step
Vizzbud is organised around a few key areas that guide you from discovering a dive site to fully understanding whether it is suitable to dive. No account is required to browse conditions. Just open the map and start exploring.
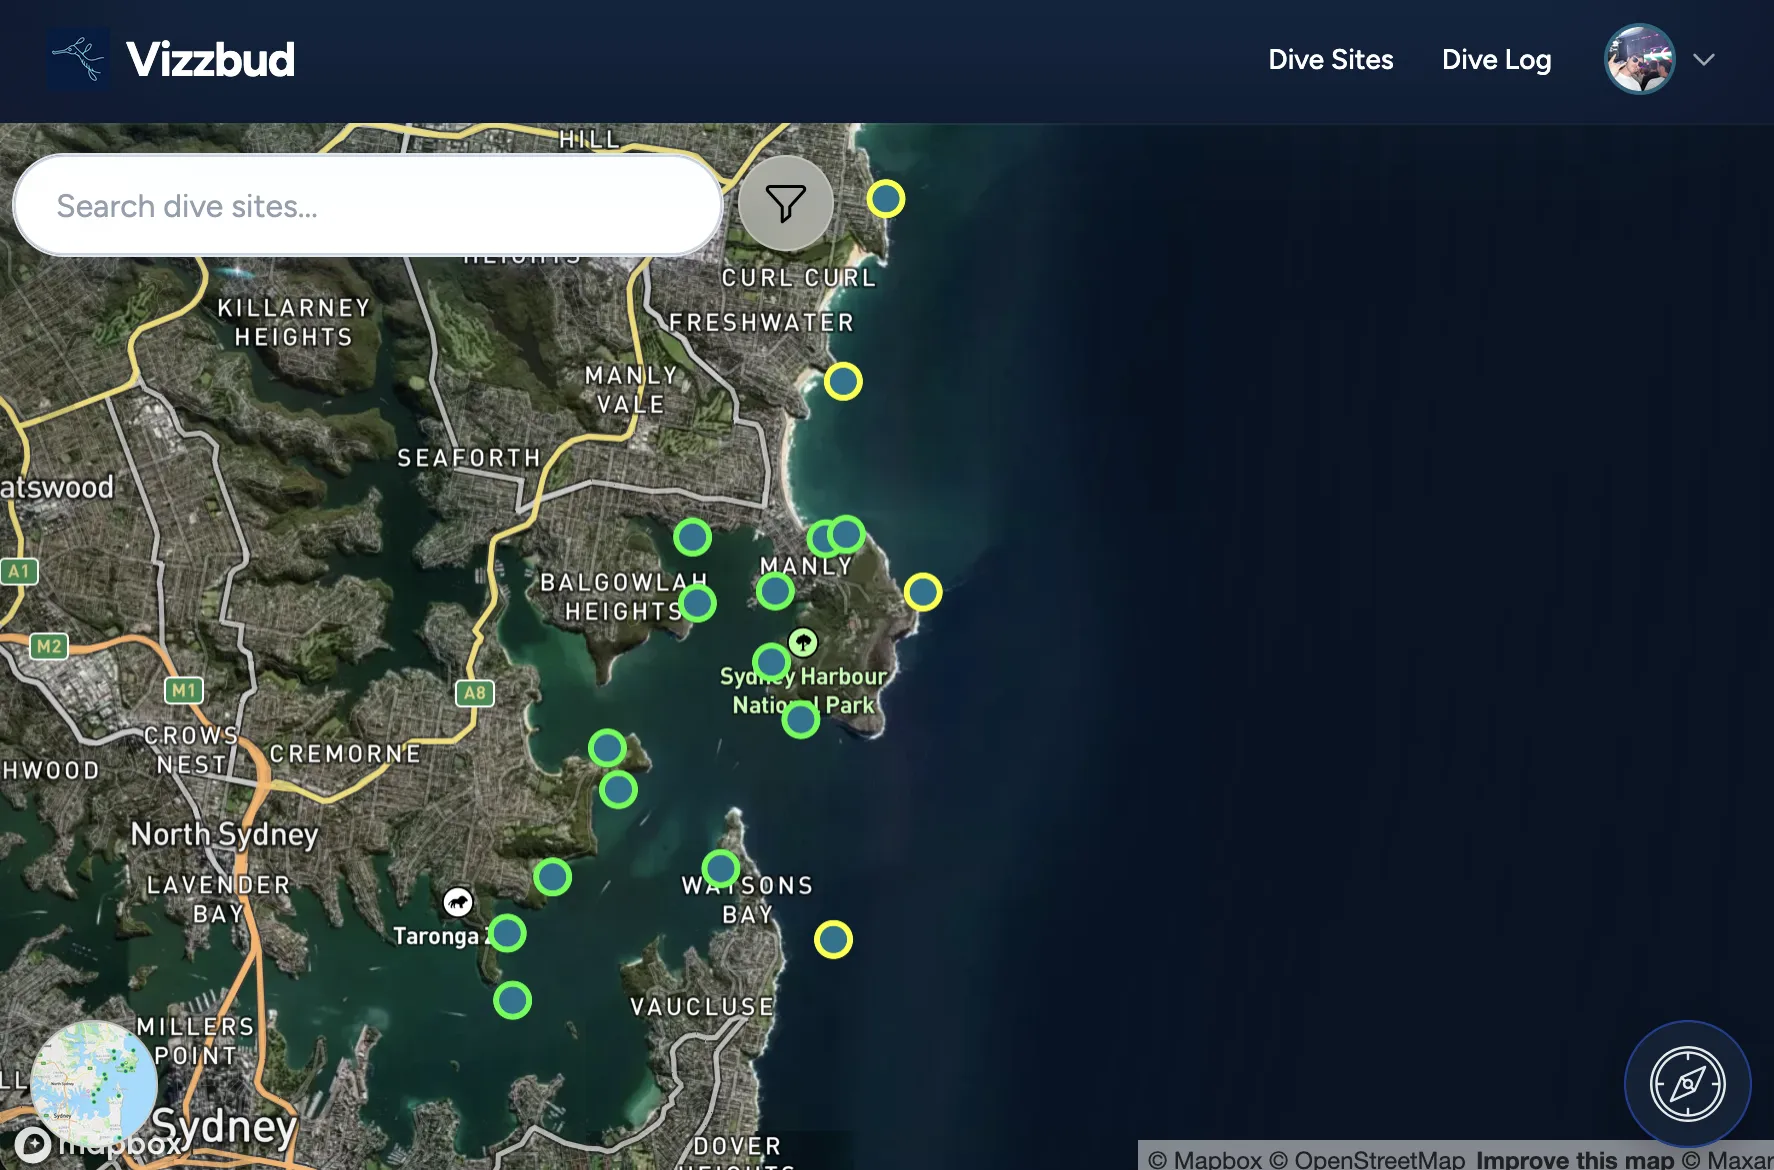
Step 1: Open the Dive Map
Head to the dive map. You will see an interactive map showing dive sites as coloured markers. Green means generally calm conditions, orange or yellow means moderate conditions requiring more awareness, and red means higher energy conditions that may be challenging. You can search for any dive site by name, zoom into your area, or tap the location button to centre the map on your position.
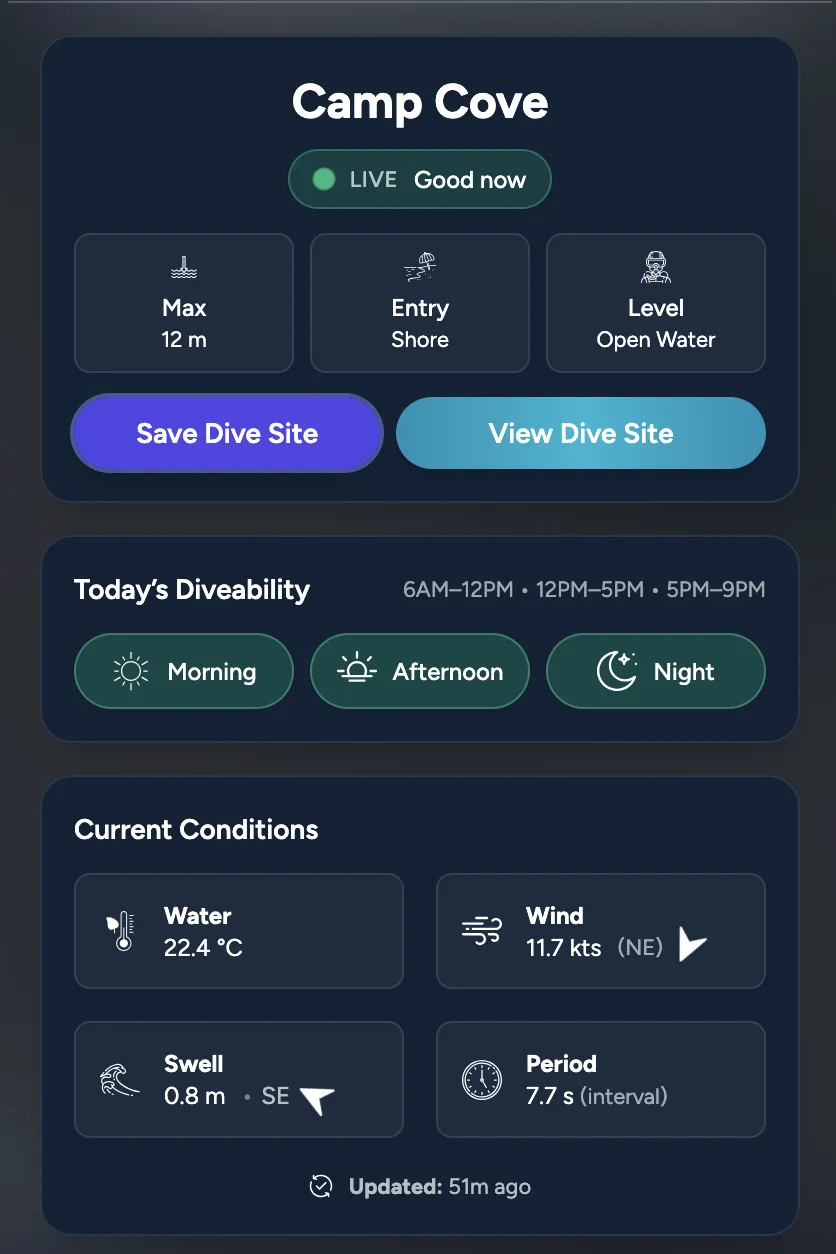
Step 2: Check the Site Preview
Click or tap any dive site marker to open the site preview card. This gives you a quick snapshot of current conditions including wave height, wind speed, water temperature, and swell direction. You will also see the day part forecast for today, a simple breakdown showing whether the morning, afternoon, and evening windows are green, orange, or red. The preview card is designed to answer the question "should I dive here today?" in a few seconds.
Step 3: Read the Full Dive Site Page
Tap "View Dive Site" to open the full page. Here you will find the 24 or 48 hour swell forecast chart, a three day breakdown by time of day, detailed dive instructions, entry and exit points, depth information, known hazards, marine life, and where available, an underwater dive map. This page is your complete guide to diving the site. It is designed to give you the same kind of briefing a local dive instructor would.
Step 4: Save, Share, or Log Your Dive
Found a site you want to come back to? Save it to your profile for quick access later. After your dive, log it in your personal dive log with depth, duration, visibility, temperature, and notes. Over time your log becomes a personal reference that helps you plan future dives with more confidence.
Understanding the Colour Coded Conditions
Vizzbud simplifies complex marine forecasts into a status that is easy to read so you can quickly understand how demanding conditions are likely to be. Every dive site marker on the map, every day part forecast cell, and every point on the swell chart uses the same three colour system.
Calmer conditions with lower wave energy and lighter winds. Generally suitable for most divers including those with less experience. Still check the full forecast before heading out.
Moderate or changing conditions. Swell, wind, or exposure may create challenges. Suitable for experienced divers who are familiar with the site, but less ideal for beginners.
Higher energy conditions with stronger swell or wind. Entry and exit may be difficult. Consider postponing or choosing a more sheltered site. Always prioritise your safety.
How the Status is Calculated
The status is calculated using a blended scoring model that considers swell height, swell period, wind strength, and how exposed the dive site is to those forces. Longer period swell and direct exposure increase difficulty, while sheltered directions reduce impact. The system intentionally leans cautious. It is better to flag a site as orange and have the dive be comfortable than to show green and have a diver caught off guard.
Where the Data Comes From
Vizzbud sources marine forecast data from global ocean weather models including NOAA (National Oceanic and Atmospheric Administration). This raw data is processed and combined with exposure analysis specific to each site, taking into account the direction a site faces, surrounding headlands, and other geographic factors, to produce interpretations that are relevant to divers rather than raw meteorological numbers.
Forecasts are updated multiple times per day. Every dive site page and map card shows the time of the most recent update so you always know how current the information is.
What You Will Find on Each Dive Site Page
Every dive site on Vizzbud has its own dedicated page with the following information:
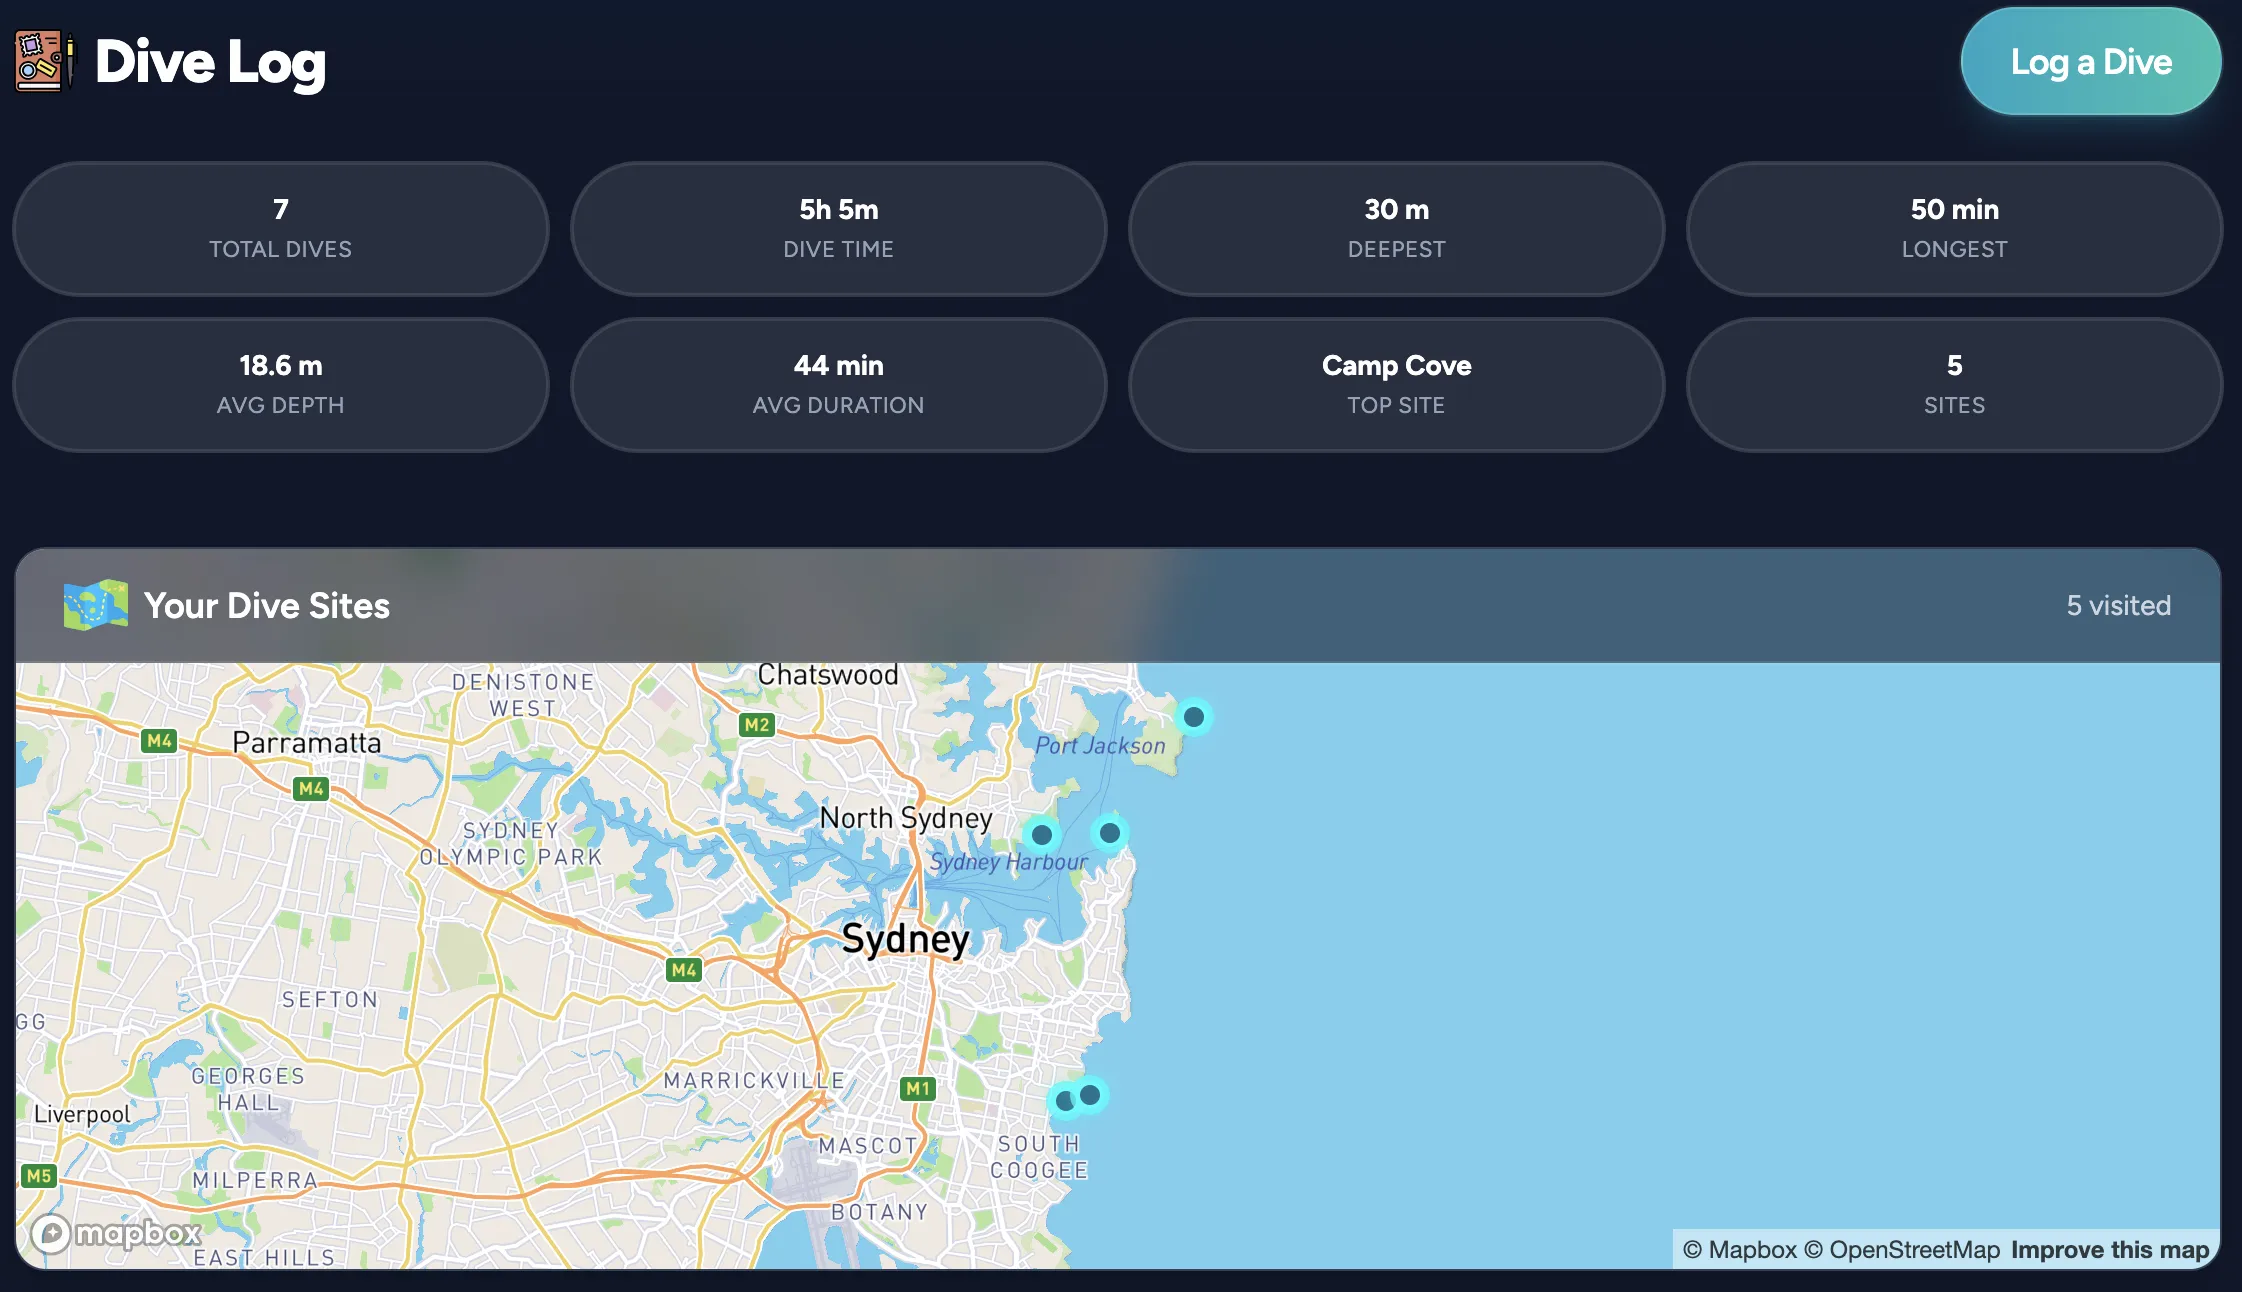
Your Personal Dive Log
With a free Vizzbud account you get a personal dive log where you can record every dive. Log details including depth, bottom time, visibility, water temperature, and your own notes. Your log builds over time into a personal reference that helps you compare conditions, track your progress, and plan future dives with more confidence.
You can also save dive sites to your profile for quick access, share sites with friends, and browse the full dive site directory to discover new locations by country, state, and region.
Frequently Asked Questions
Is Vizzbud free?
Yes, completely free. The dive map, conditions, forecasts, and all dive site pages are available without creating an account. A free account unlocks the personal dive log and saved sites.
Where does the forecast data come from?
Vizzbud sources marine data from global ocean weather models including NOAA. This data is processed and combined with exposure analysis tailored to each site to produce interpretations that are relevant to divers rather than raw meteorological numbers.
What dive sites does Vizzbud cover?
Vizzbud currently covers dive sites across Australia with selected international locations being added regularly. You can browse all available sites on the dive site directory or search the dive map.
How often are conditions updated?
Forecasts are updated multiple times per day. Each dive site page shows the exact time of the most recent update so you know how current the data is.
What do the green, orange, and red markers mean?
Green means generally calm conditions that are good for diving. Orange or yellow means moderate conditions requiring more awareness. Red means higher energy conditions that may be challenging. The status is based on swell height, swell period, wind, and site exposure.
Does Vizzbud work on my phone?
Yes. Vizzbud is fully responsive and works on phones, tablets, and desktops. You can install it as a progressive web app on your home screen for quick access. Just open the site in your mobile browser and choose "Add to Home Screen".
Can I suggest a dive site that is not listed?
Absolutely. Each dive site page has a suggestion form at the bottom where you can submit information about a missing site or suggest corrections to an existing one. Community input helps make Vizzbud better for everyone.
Do I need scuba certification to use Vizzbud?
No certification is needed to use the platform. Vizzbud is useful for scuba divers, freedivers, snorkellers, and anyone who wants to check ocean conditions before visiting a coastal location. However, always dive within your training and experience level.
Start Using Vizzbud
Open the dive map to check conditions right now, or create a free account to start logging your dives.