How Vizzbud Works
What is Vizzbud?
Vizzbud is a diving platform designed to make planning dives simpler and clearer. It helps divers understand dive conditions at a glance while still providing detailed information when needed.
The site combines live forecasting data, site exposure analysis, and practical dive instructions so you can quickly judge whether a location is suitable before heading out. Each dive site also includes guidance on how to dive it safely, not just what the ocean is doing.
Beyond planning, Vizzbud acts as a hub for divers — allowing users to explore locations, track and log their dives, and interact with the community while building a personal history of their diving activity.
How to Use Vizzbud
Vizzbud is organised around a few key areas that guide you from discovering a dive site to fully understanding whether it is suitable to dive.
1. The Dive Map
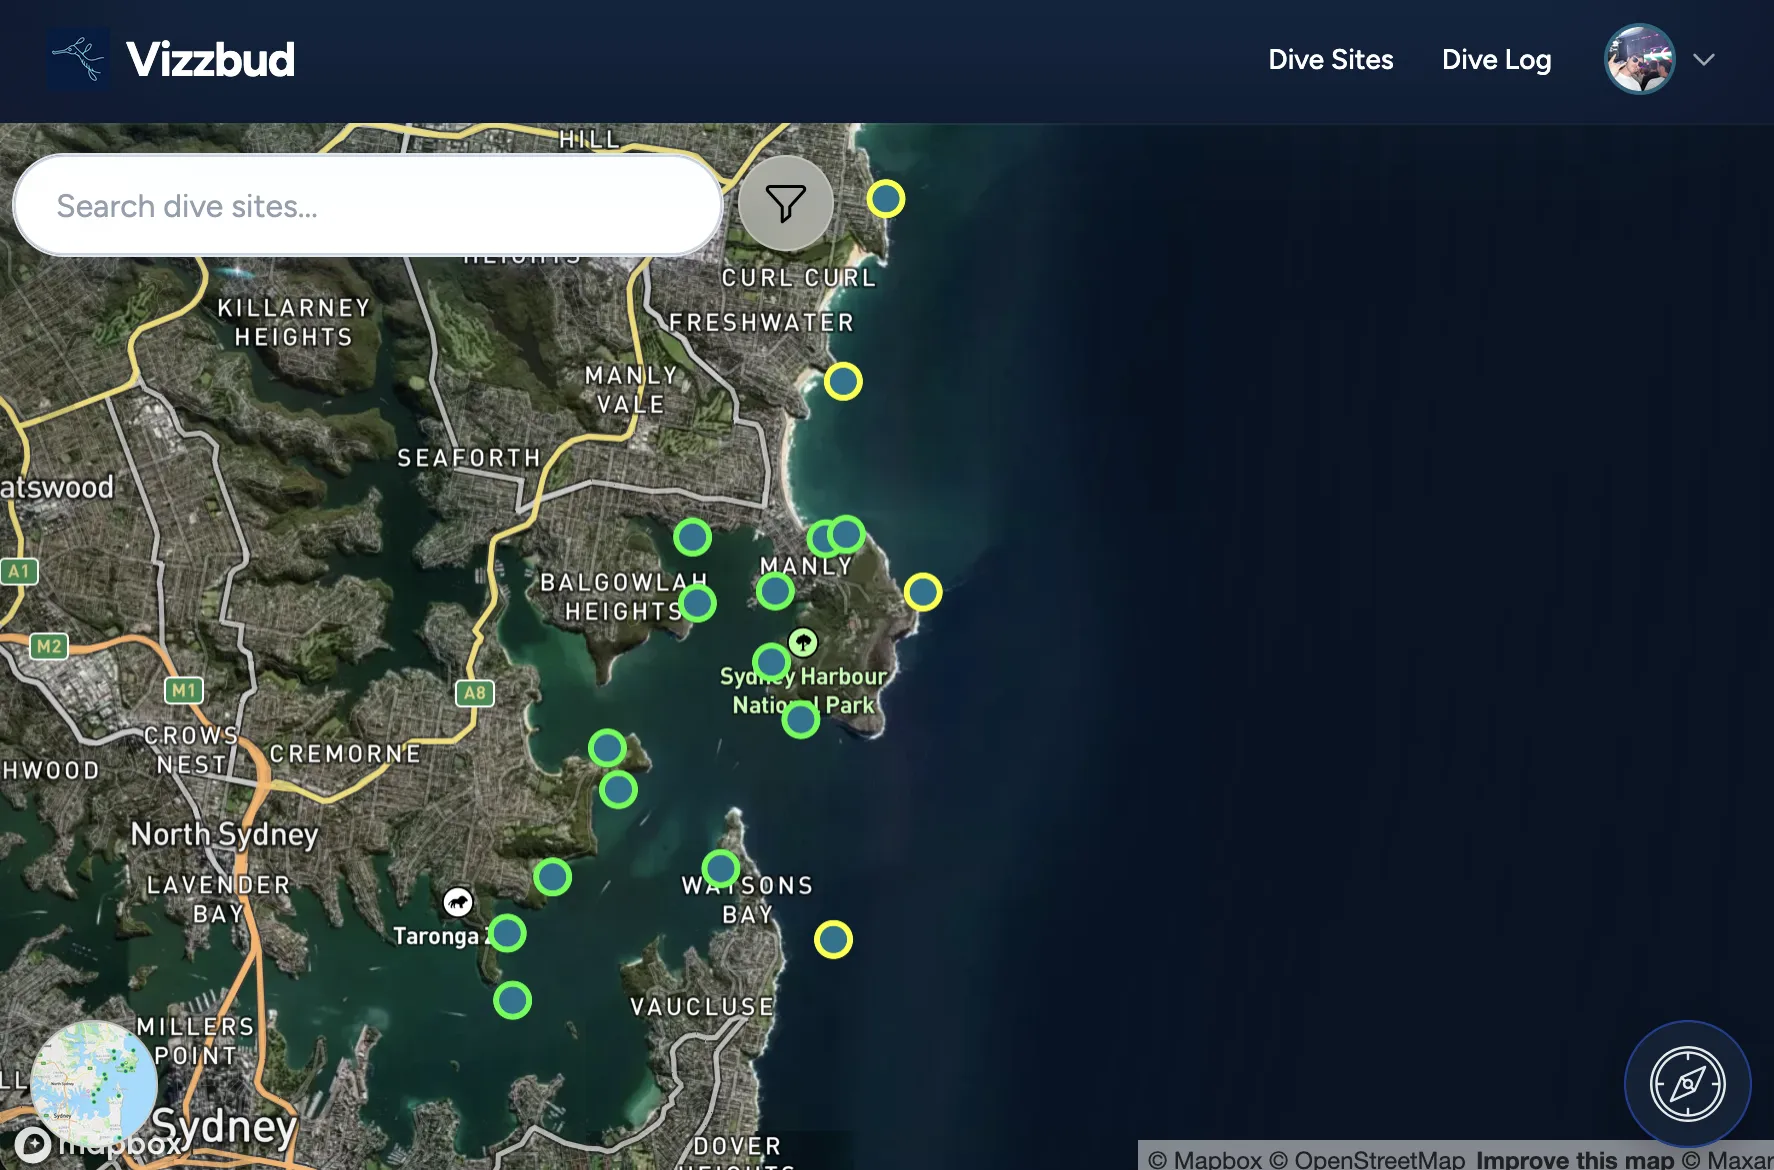
The dive map shows all dive sites in your area. Each marker is coloured green, orange, or red to represent how diveable the conditions are likely to be. Understanding these colours is important as they quickly indicate whether a site may be calm, marginal, or challenging.
You can also search the map to find any dive site in the system.
2. Site Preview Card
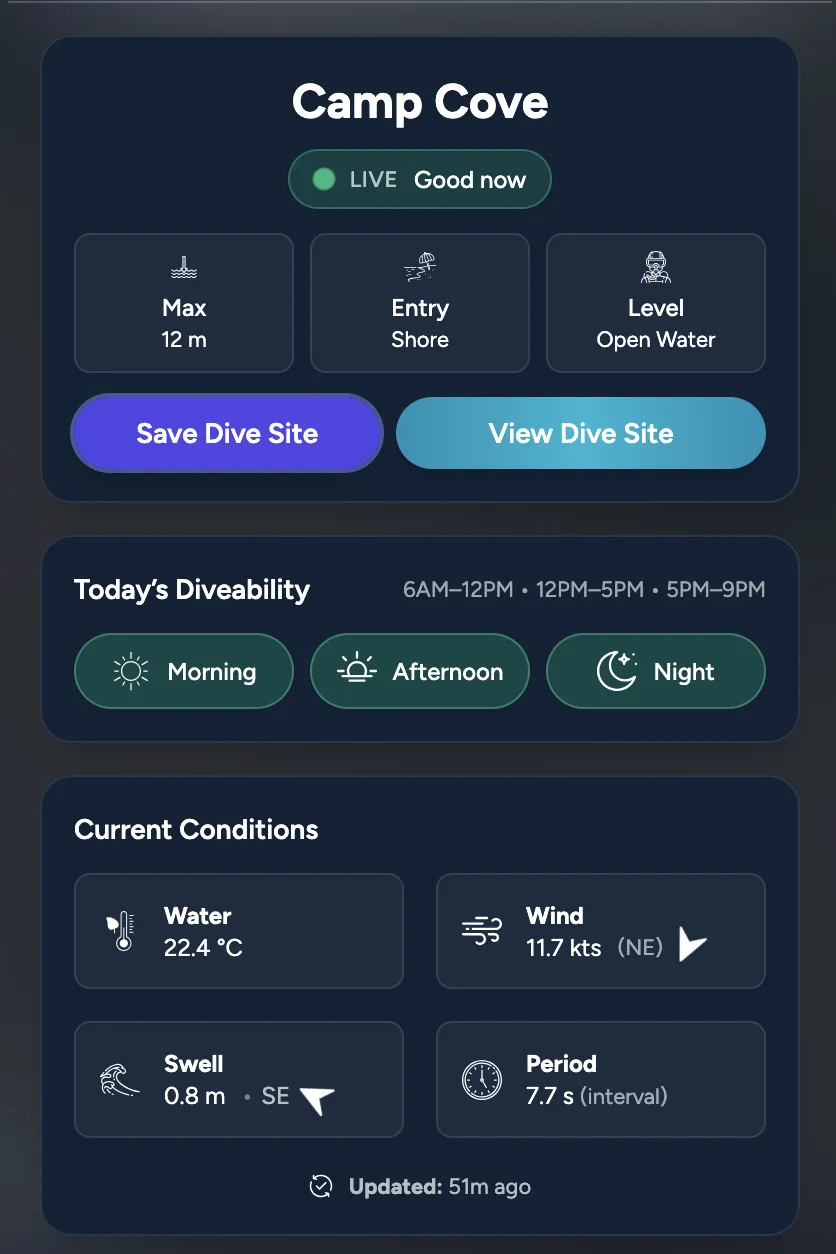
Clicking a dive site opens a quick information card. Here you can see the current conditions, a simple day-part forecast for the current day, and additional key details about the location.
3. Full Dive Site Page
Selecting the full dive site view provides a detailed page with deeper forecasts, guidance on how to dive the site, and extended information to help you make a confident decision before heading out.
Understanding Conditions & Map Status
Vizzbud simplifies complex marine forecasts into an easy‑to‑read status so divers can quickly understand how demanding conditions are likely to be. Each dive site marker uses a colour system to indicate overall difficulty based on the predicted ocean energy affecting that location.
Generally calmer conditions and lower wave energy.
Moderate or changing conditions — more awareness required.
Higher energy conditions that may be challenging.
The status is calculated using a blended scoring model that considers swell height, swell period, wind strength, and how exposed the dive site is to those forces. Long‑period swell and direct exposure increase difficulty, while sheltered directions reduce impact. The system intentionally leans cautious so divers notice potential risks early.
Forecast data is sourced from marine weather models and updated regularly for each site. Vizzbud processes this data and combines it with site‑specific exposure analysis to produce a clearer interpretation rather than raw numbers alone.
The map is designed to provide fast context, while individual dive site pages contain the detailed forecasts and explanations needed to fully understand conditions before diving.
Join the Vizzbud Community
Creating an account unlocks the full Vizzbud experience. You can log your dives, keep personal records, and build a history of your diving activity over time.
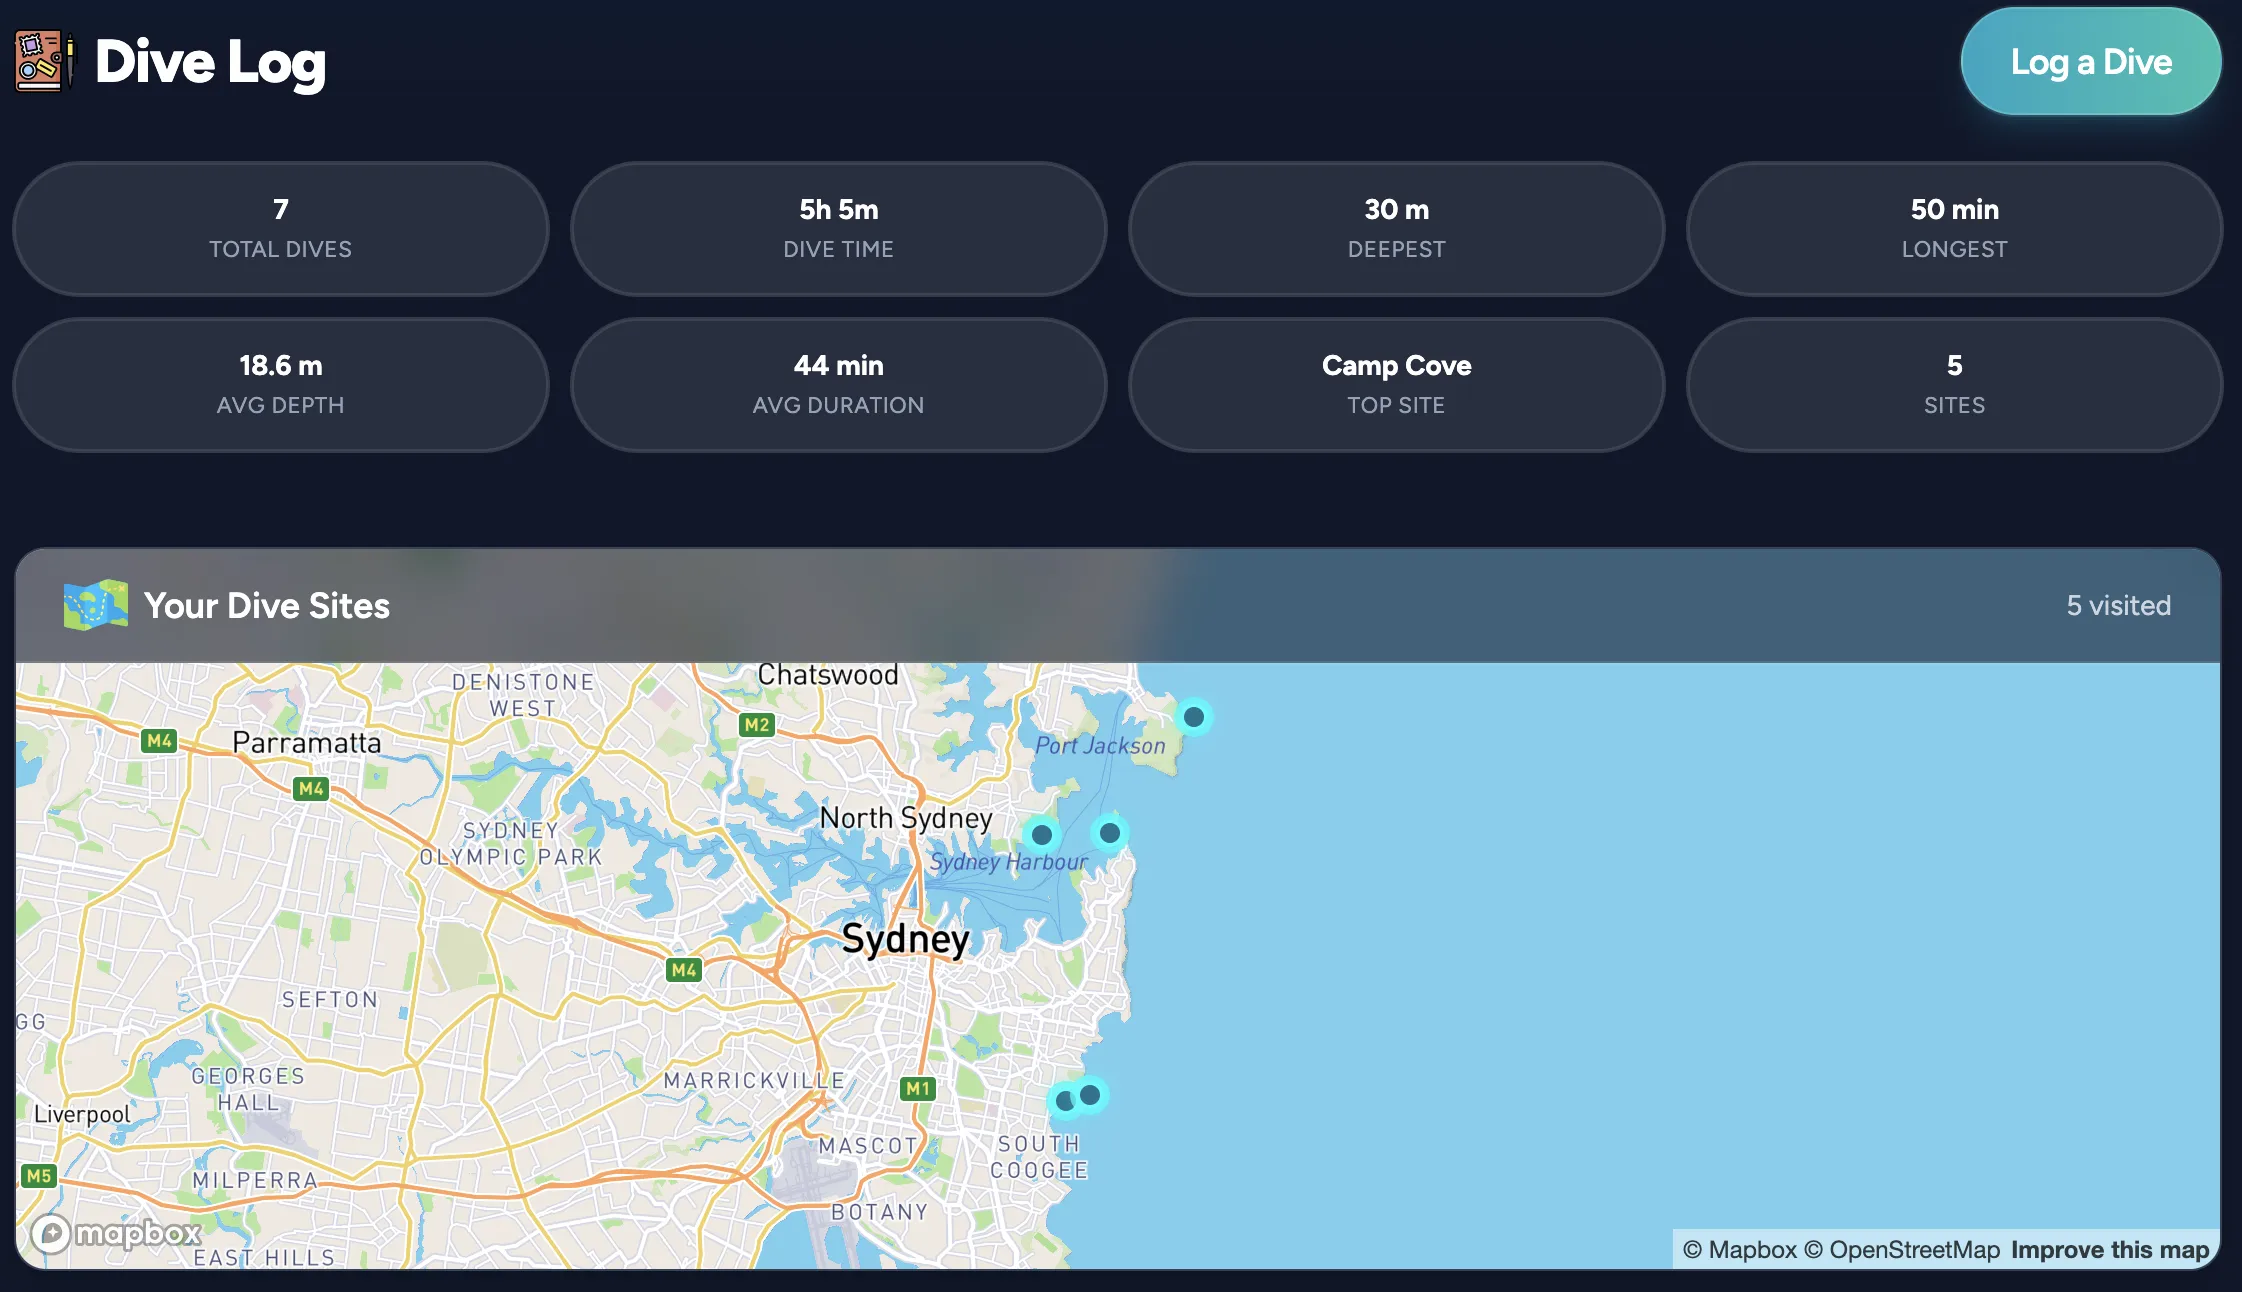
Your dive log lets you track depth, duration, visibility, notes, and other useful details so you can learn from past dives and monitor your progress. Over time this becomes your personal reference for planning future dives more confidently.
Soon, Vizzbud will also include diver profiles and ways for users to interact with one another — turning the platform into a shared space for discovering locations, sharing experiences, and learning together.